
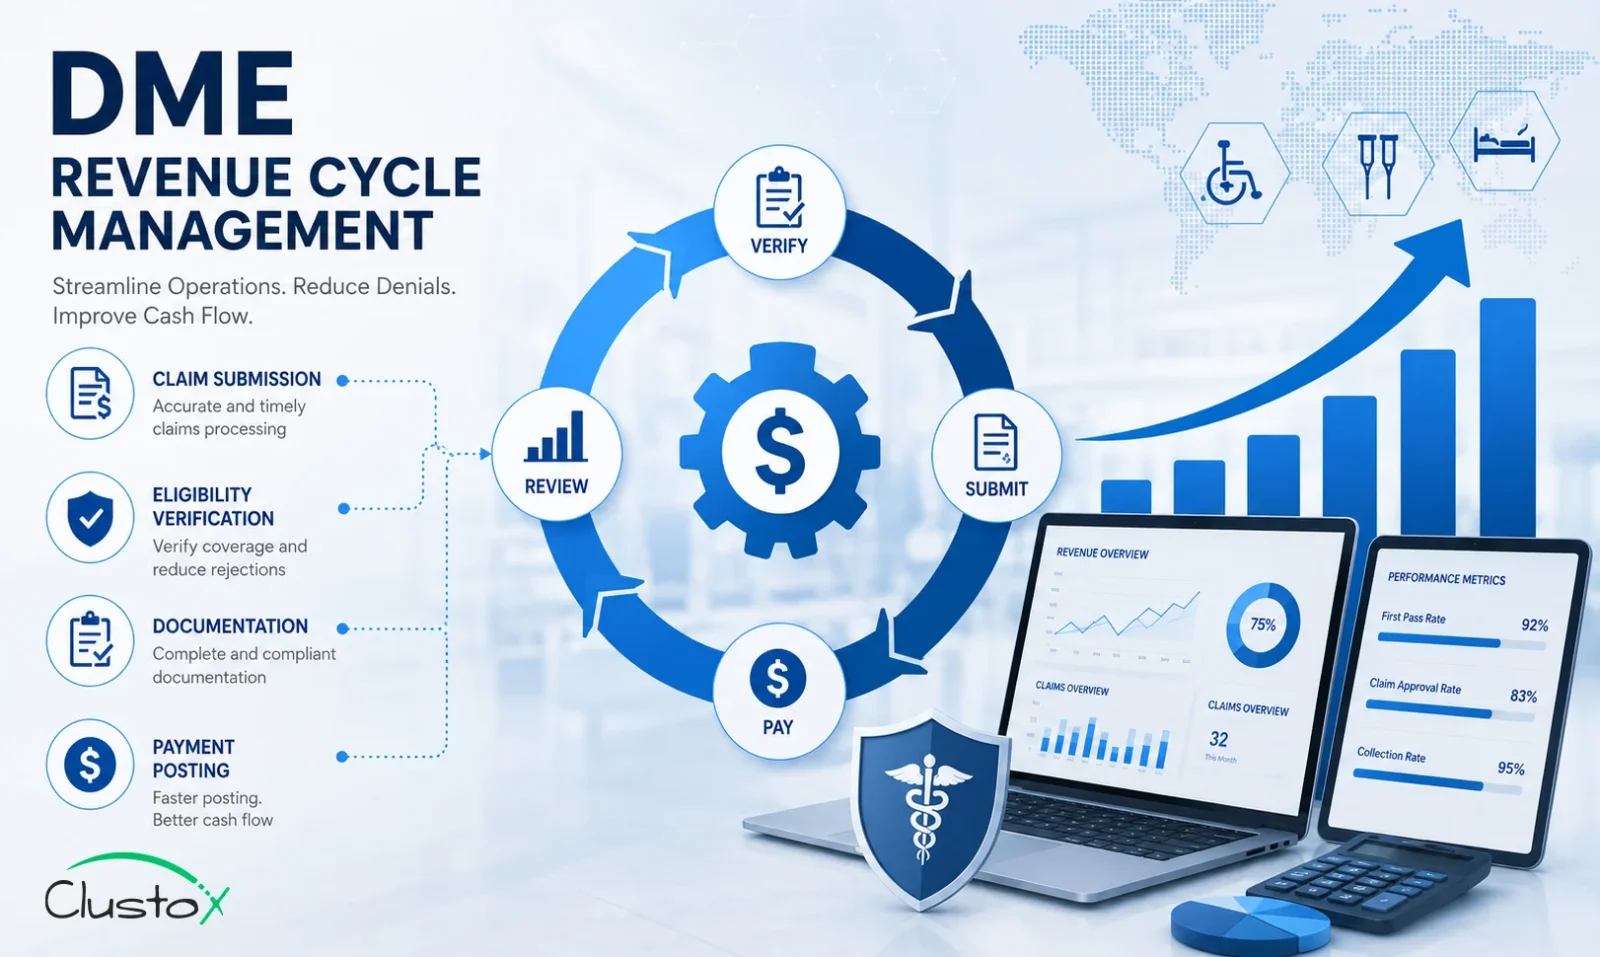

DME revenue cycle management covers every step from patient intake to payment, prior authorization, eligibility verification, claims submission, denial management, and resupply outreach. For most providers running between $10M and $80M in revenue, these workflows consume 15–25% of net revenue in labor and write-offs. Automation targets exactly those costs.
What this article covers
- Where your revenue cycle is bleeding margin, and how to quantify it
- Workflow-by-workflow ROI benchmarks for prior auth, denial management, re-supply, and intake
- How to build a defensible automation business case for your board or PE sponsor
- What the implementation actually costs and what to expect in year one
- The questions your CFO or VP Finance will ask before signing off
Your revenue cycle is not a billing problem. It is a margin problem.
If you run a DME company with $10M to $80M in revenue, your revenue cycle, prior authorization, eligibility verification, claims submission, denial management, and resupply outreach are almost certainly one of your top two operational cost lines. And unlike equipment costs or COGS, it scales with your headcount, not your software.
That is the problem automation actually solves.
Not “AI for healthcare.” Not a chatbot on your intake form. The specific, measurable reduction in cost per auth, denial write-off rate, and coordinator hours per resupply cycle are the numbers your CFO or PE sponsor will ask about before any conversation goes further.
This article is built around that conversation. You will find workflow-level cost benchmarks, ROI ranges by automation type, a four-layer business case framework, and a plain-language answer to what implementation actually requires from your team.
If you are a CFO, owner, or VP of Finance evaluating whether revenue cycle automation makes financial sense for your DME, this is the reference you need to build a defensible answer.
Table of Contents
What Does DME Revenue Cycle Management Actually Cost You?
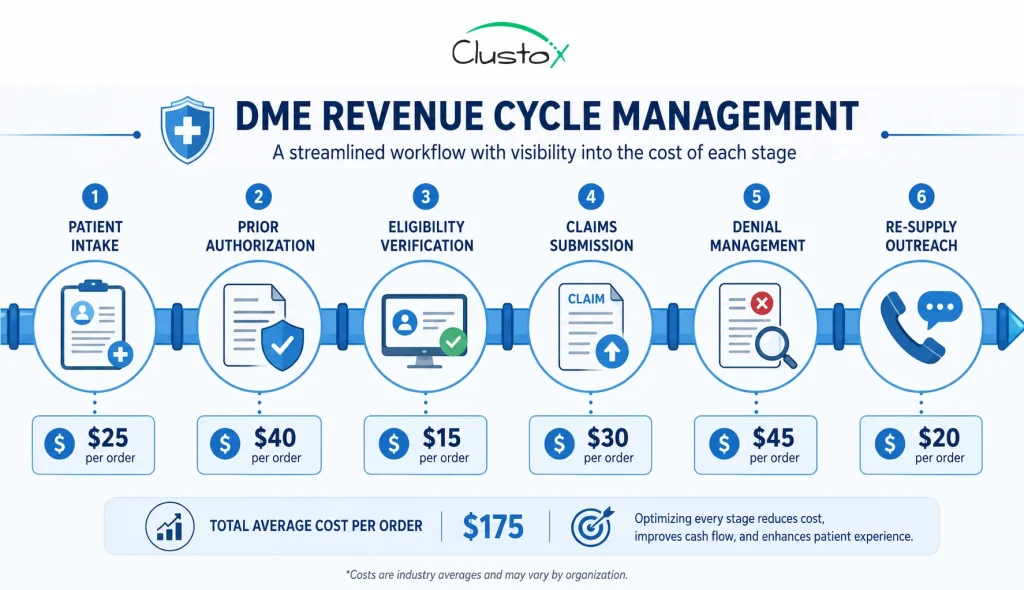
If you run a DME company, your revenue cycle is probably your largest operational cost line outside of equipment and COGS. Yet most finance leaders do not have a single number for what it costs to process a prior authorization, work a denial, or run a resupply outreach cycle. They have headcount. They have write-off percentages. They have payer rejection rates. What they rarely have is a workflow-level cost model.
That gap is expensive. When you cannot see the cost at the workflow level, you cannot prioritize automation at the workflow level. You end up buying point solutions that address symptoms, not the underlying labor intensity.
The table below gives you the baseline benchmarks. These ranges are directional benchmarks derived from industry experience, publicly available payer/CMS references, and operational workflow analysis.
They are drawn from operator experience, industry reference ranges, and publicly available CMS and payer data. Flag anything that materially differs from your own numbers as a calibration point.
| Revenue Cycle Workflow | Typical Manual Cost | Automation Range | Recovery Lever |
|---|---|---|---|
| Prior authorization processing | $18–$28 per auth | 60–75% cost reduction | Speed + staff redeployment |
| Eligibility & benefits verification | $5–$12 per check | 50–70% cost reduction | Fewer manual checks |
| Denial management & appeals | 15–25% of denials written off | 18–27% soft denial recovery | Automated appeal drafting |
| CPAP re-supply outreach | 1.5–2 FTE per 1,000 active patients | 40–60% headcount avoidance | Outbound automation |
| Claim status follow-up | 12–18 min per claim | 70%+ touchless rate | Workflow automation |
| Patient intake & documentation | 20–35 min per new patient | 50–65% time reduction | Structured data capture |
Work through those numbers with your own monthly volumes. If you are running 300 prior auths per month and your cost per auth is $22, that is $6,600 per month in authorization labor alone. That is before you count the claim delay cost, the equipment sitting idle during the auth window, and the re-verifications when an auth expires.
How Much Does Prior Authorization Actually Cost, and What Can Automation Change?
Prior authorization is the single highest-labor workflow in DME revenue cycle management. A single auth for a complex piece of equipment, a power wheelchair, a ventilator, or a custom CPAP setup, can take 45 to 75 minutes of staff time across intake, documentation gathering, payer portal submission, and follow-up calls.
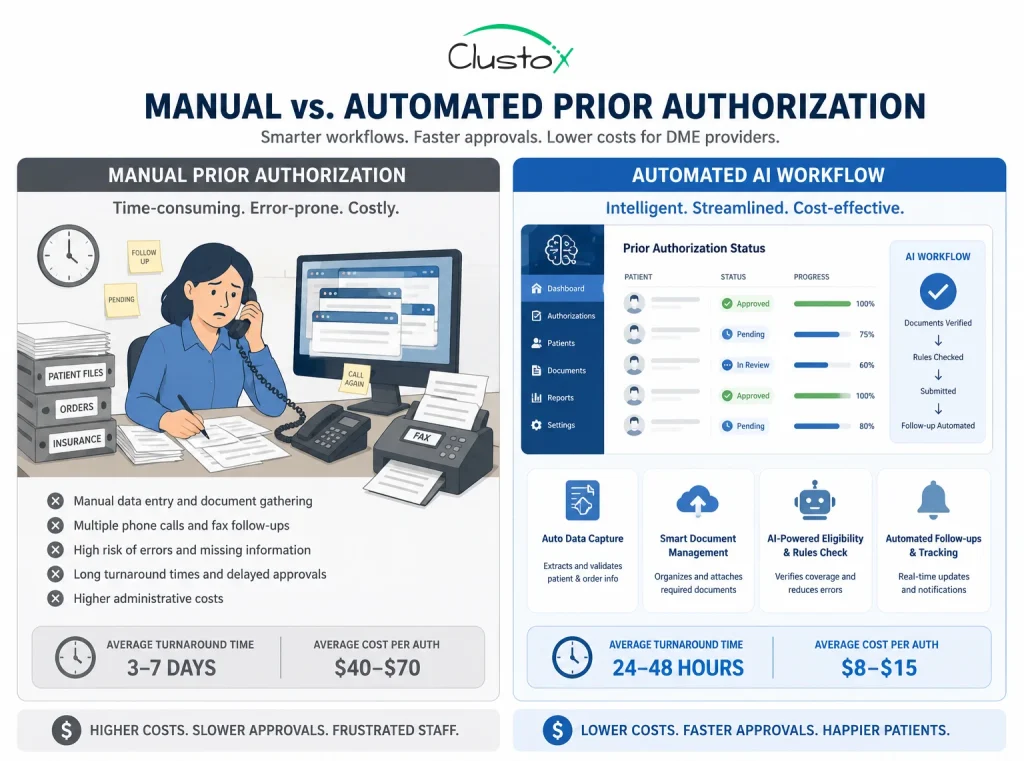
For a multi-state DME running 500 authorizations per month, that is a meaningful headcount problem.
| Metric | Manual Process | AI-Assisted Workflow |
|---|---|---|
| Time per prior auth | 3–10 business days | 1–2 business days |
| Staff time per auth | 45–75 minutes | 8–12 minutes (review only) |
| Cost per auth (labor) | $18–$28 | $4–$8 |
| Monthly auth volume (500 auths) | $9,000–$14,000 | $2,000–$4,000 |
| Annual cost (500 auths/month) | $108K–$168K | $24K–$48K |
| Annual savings potential | — | $60K–$120K+ |
For Example:
A mid-sized DME processing 500 prior authorizations monthly may spend the equivalent of 1.5–2 full-time coordinators managing documentation gathering, payer portal submissions, and follow-up. With workflow automation and exception-based review, much of that administrative workload can shift from manual processing to oversight, reducing handling time while improving turnaround consistency.
The automation case here is straightforward. An AI agent working on top of your existing Brightree or NikoHealth instance can assist with documentation gathering, eligibility pre-checks, workflow routing, and submission preparation without a human touching it until the auth comes back needing a clinical review or exception handling.
What that actually means for your P&L: staff who were processing auths full-time shift to exception handling. You process the same volume with fewer FTEs, or you absorb growth without adding headcount. For a PE-backed DME going through a roll-up, that headcount leverage is exactly what the deal model expects.
What automation does not change
Prior auth automation does not eliminate clinical judgment requirements. A physician’s signature on an LMN (letter of medical necessity) still needs a physician. A complex eligibility dispute still needs a human. Automation handles the administrative structure around those clinical gates; it does not replace the gates.
What Is the Real ROI of DME Denial Management Automation?
Denial management is where most DME revenue cycle ROI conversations get stuck. Finance leaders know denials cost money. What they struggle to quantify is the recoverable portion and, therefore, the ROI of building a system to recover it.
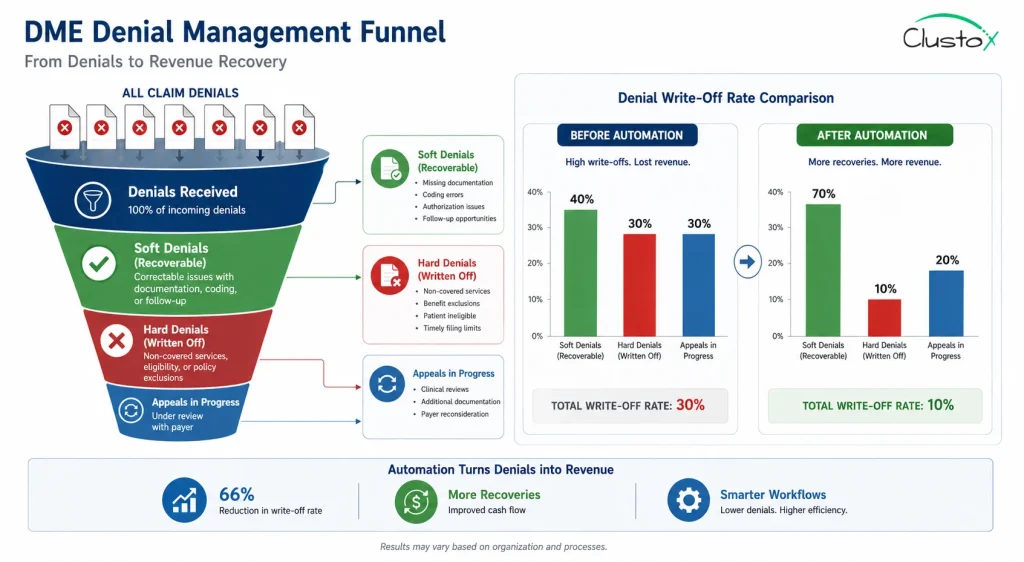
The distinction that matters is between hard denials and soft denials.
Hard denials are non-recoverable. The claim was submitted for a non-covered service, the patient was not eligible, or the timely filing window had passed. Writing these off is the right call.
Soft denials are recoverable if you work them quickly. Documentation was incomplete. The auth number was missing. A coordination of benefits question needs resolution. These denials are not rejections of the claim; they are requests for more information. Left alone, they become hard denials. Worked promptly, a large fraction converts to paid claims.
| Denial Category | Typical Write-Off Rate | Automation Recovery Potential |
|---|---|---|
| Prior auth missing or expired | High (often 100% write-off) | Preventable with upstream AI |
| Eligibility mismatch at time of service | 60–80% written off | Significant reduction potential with automated real-time eligibility checks |
| Soft denials (documentation gaps) | 25–35% written off | 18–27% recovered via auto-appeal |
| Coding errors (HCPCS) | Varies by payer | Reduced with AI code validation |
| Timely filing | 100% write-off | Substantially reduced with automated follow-up workflows |
Automation’s role in denial management is not to dispute claims autonomously. It is to catch the soft denial fast, pull the documentation needed to cure it, draft the appeal or resubmission, and route it to the right person within hours, not days.
If your denial management cycle currently runs 15 to 20 business days from denial to resubmission, and you are writing off 25% of your soft denials because they age out, you have a recoverable revenue problem that scales with your volume. A $30M DME writing off 3% of net revenue in soft denials is leaving $900K on the table annually.
How to calculate your soft denial recovery potential
- Pull your denial data for the last 12 months from Brightree or your clearinghouse reports.
- Separate hard denials from soft denials by denial code.
- Calculate what percentage of soft denials were cured versus written off.
- Apply a conservative 18% recovery rate to your write-off total.
- That number is your annual soft denial recovery potential before subtracting automation cost.
How Do You Quantify the ROI of CPAP Resupply and Recertification Outreach Automation?
CPAP resupply is one of the highest-margin recurring revenue streams in DME and one of the most labor-intensive to maintain. Patients need to be contacted at regular intervals for resupply eligibility, usage compliance data needs to be pulled, payer authorization may need renewal, and the order needs to be initiated and documented before a single piece of equipment ships.
For a DME running 1,000 active CPAP patients, that outreach cycle consumes roughly 1.5 to 2 FTE of coordinator time, not because each contact is complex, but because volume and compliance cadence make it relentless.
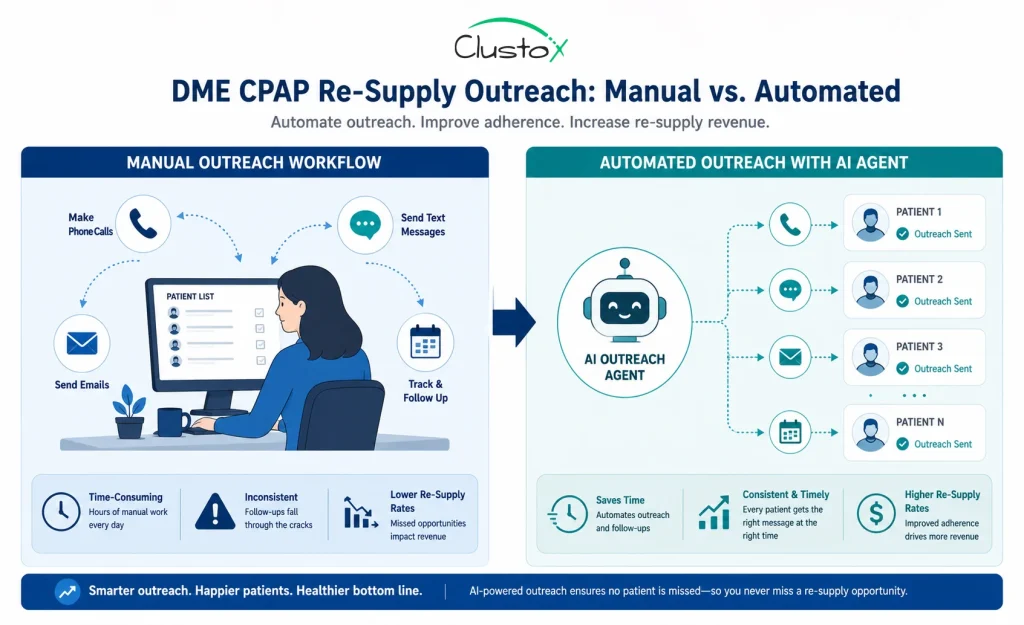
The automation case for re-supply outreach is among the most defensible in DME revenue cycle management, for three reasons.
- The outreach content is predictable and templated, exactly the kind of work where AI agents well-suited for automation at scale due to its repetitive and structured nature.
- Compliance data (device hours, leak rate, AHI) is structured and already sitting in your connected care platform or Brightree integration.
- The consequence of missed outreach is direct: the patient does not reorder, the payer does not reimburse, and a recurring revenue event disappears from your books.
Re-supply ROI estimate
Active CPAP patients: 1,000
Outreach cycles per patient per year: 4 (quarterly eligibility + annual recertification)
Staff cost per outreach cycle (manual): $8–$14 per patient contact
Annual manual outreach cost: $32K–$56K in labor
Automation: reduces staff cost per contact to $1–$3, handling initiation, compliance pull, and scheduling
Annual savings estimate: $20K–$44K in coordinator labor, before accounting for increased compliance rate and reduced missed-resupply revenue leakage
Beyond the direct labor saving, automated re-supply outreach tends to improve compliance rates. Patients who receive timely, personalized contact are more likely to complete the resupply order, which means more reimbursable units shipped per year per patient.
How to Build a DME Automation Business Case That Survives Board Scrutiny
The most common reason DME automation projects stall is not technical. It is the business case. The finance team sees a software line item. The operations team sees a change management problem. The board sees unquantified risk. None of them are wrong. The answer is a structured ROI model that addresses each concern directly.
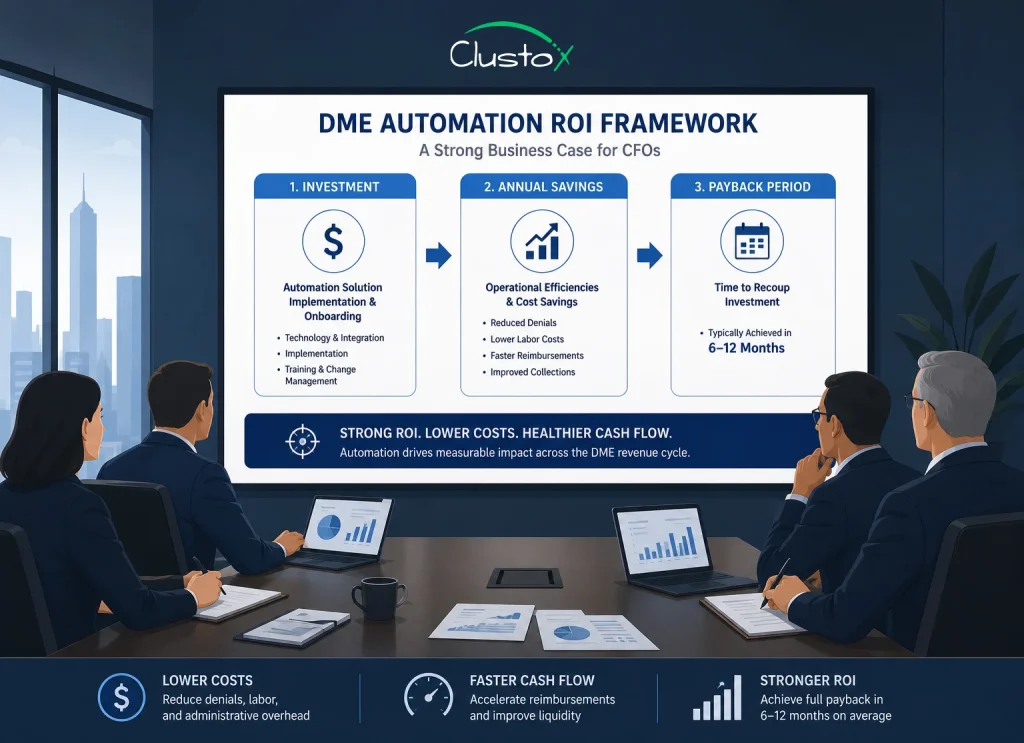
The four-layer ROI model
Layer 1: Direct labor savings.
Quantify the FTE hours currently consumed by the workflows you are automating. Use your actual wage rates, not averages. Include benefits load (typically 25–35% on top of wages). This is your most defensible number.
Layer 2: Denial recovery.
Calculate your soft denial write-off total for the last 12 months. Apply a conservative recovery rate (18–20%). This is incremental revenue, not cost avoidance; it’s easier to defend to a CFO.
Layer 3: Revenue velocity.
Prior authorization delays mean equipment sits. A 3-day reduction in average auth turnaround time on 500 monthly auths can mean you bill and collect 1,500 patient-days earlier per month. At your average monthly rental rate, calculate what that is worth in working capital.
Layer 4: Headcount scalability.
If you are growing, organically or through acquisition, model the headcount you would need to add to maintain current revenue cycle performance. The automation cost is fixed. The headcount cost scales with volume. That crossover point is usually the most compelling number in the deck.
What Does a DME Revenue Cycle Automation Implementation Actually Cost and Require?
The CFO’s second question, after the ROI model, is always, “What does this actually cost, and what do we need to do internally to make it work?”
The honest answer is that implementation cost varies significantly based on three factors: the complexity of your existing tech stack, the number of workflows you are automating simultaneously, and whether you are starting from a structured data environment or a partially manual one.
What a phased implementation typically looks like
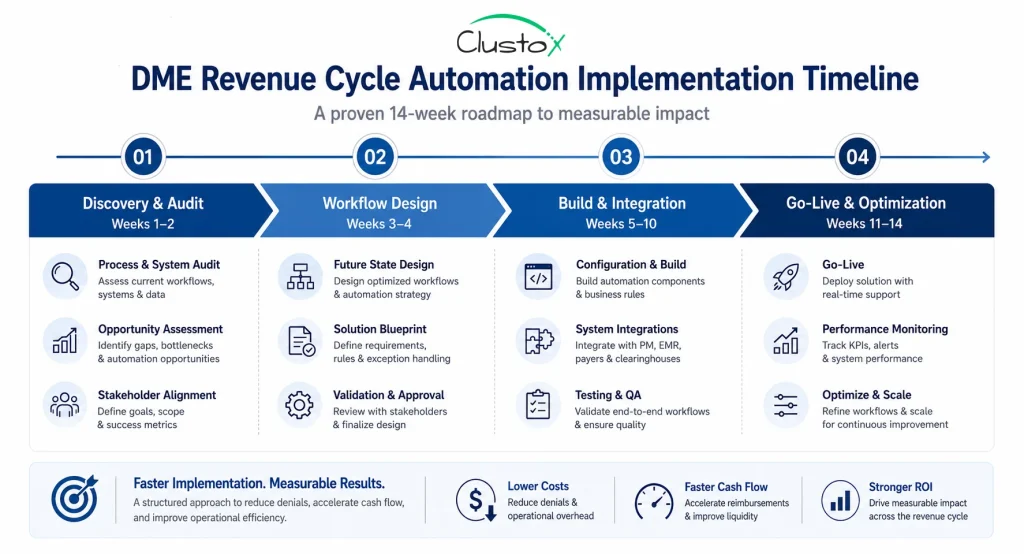
Phase 1: Discovery and audit (2–3 weeks)
Map your current revenue cycle workflows end-to-end. Document where humans touch the process, what systems are involved (Brightree, payer portals, clearinghouses, and internal spreadsheets), and where the data quality issues sit. This phase produces the automation priority list.
Phase 2: Workflow design and data readiness (2–3 weeks)
Design the AI agent workflows. Identify integration points with your PMS or billing platform. Resolve data structure issues that would break the automation (missing fields, inconsistent coding, non-standard LMN documentation).
Phase 3: Build and Integration (4–8 weeks)
Develop the agents, connect the integrations, and run parallel testing against your live workflow. Prior authorization automation and denial management can typically run in parallel; resupply outreach is often phased in separately.
Phase 4: Go-live and optimization (ongoing)
Launch with supervised operation, humans reviewing AI outputs before submission. Over 4–8 weeks, move to exception-based review as accuracy benchmarks are met. Monitor denial rates, auth turnaround times, and resupply conversion weekly.
What you need internally
- A named operations owner for the project, typically your director of Billing or VP revenue cycle.
- Access to clean exports from Brightree, NikoHealth, or your clearinghouse for historical claim and denial data.
- IT or data team availability for API integration work (usually 2–4 hours per integration point, not a large commitment).
- Willingness to run a 4–6 week parallel period before full go-live.
Frequently Asked Questions (FAQs)
How long does it take to see ROI from DME billing automation?
Most DME providers running prior auth and denial management automation see measurable cost reduction within the first 60 to 90 days of go-live. Soft denial recovery ROI typically materializes in month two or three, as the first automated appeal cycles complete. Full payback on the implementation investment typically runs 5 to 12 months depending on your starting volume and denial rates.
Is HIPAA compliance a concern with AI-based DME revenue cycle tools?
Yes, and it must be addressed in architecture, not as an afterthought. Any AI workflow handling PHI (protected health information) requires HIPAA-compliant infrastructure: BAA (business associate agreement) with every vendor in the chain, encryption at rest and in transit, role-based access controls, and audit logging. This is non-negotiable for CMS-enrolled providers and accreditation holders.
What is the difference between RPA and AI agents for DME billing?
RPA (robotic process automation) follows fixed rules and scripted steps. It works for highly repetitive, structured tasks where the process never changes. AI agents can handle variability, different payer portals, incomplete documentation, and ambiguous denial codes and take action based on context rather than a fixed script.
How does DME revenue cycle automation affect my billing staff?
In most implementations, billing staff shift from high-volume data entry and status checking to exception handling and relationship management. Authorization coordinators who previously processed 15 to 20 auths per day shift to reviewing exceptions and managing complex cases.
This is typically a positive change for retention and job satisfaction. Whether it reduces headcount depends on your growth rate: fast-growing DMEs often absorb the efficiency gain through volume rather than headcount reduction.
Conclusion: The Revenue Cycle Decision Every DME Finance Leader Has to Make
The case for DME revenue cycle automation comes down to margin, scalability, and recoverable revenue. Prior authorization, denial management, and resupply outreach are labor-heavy workflows that become more expensive as your volume grows. Automation reduces that operational burden while improving turnaround times, denial recovery, and staff efficiency.
The providers seeing the strongest ROI are not trying to automate everything at once. They start with one high-impact workflow, measure the results, and expand from there. Prior auth automation, soft denial recovery, or CPAP resupply outreach are often the fastest paths to measurable savings.
If you are evaluating whether automation makes financial sense for your DME, start with your workflow-level costs, denial recovery potential, and headcount scalability model. That gives you the foundation for a defensible business case before you evaluate vendors or platforms.
Manual workflows should not be limiting your growth.
Clustox identifies your highest-cost revenue cycle bottlenecks and builds an automation roadmap tailored to your DME operation.
Note:
The financial figures and operational benchmarks in this article are illustrative estimates based on industry observations, workflow modeling, publicly available payer/CMS references, and operator experience. Actual costs, savings, recovery rates, and implementation timelines vary significantly based on payer mix, workflow maturity, staffing structure, and technology environment.