

Most companies don’t plan to build their own analytics software.
They start with Tableau. Or Power BI. Or Looker. It works until product, data, and scale requirements start diverging from what these tools can support.
Then comes the moment every CTO recognizes: you’re paying $40,000+ a year for a tool. It can’t model your data the way you need. It can’t be embedded into your product. It can’t scale without another costly add-on.
That’s when the question shifts from “which BI tool should we use” to “should we just build the solution ourselves?”
However, it comes with a real cost, one that most vendors will not provide a straightforward answer to.
This blog does. It breaks down exactly:
- What does custom analytics software actually cost to build?
- What pushes that number up or down?
- When does building make more sense than buying?
You’ll get clear answers to all three, with real figures, real complexity tiers, and no vague estimates.
Types of Analytics Software: Which One Are You Building?
Analytics software like Tableau is not one thing. It is a category, and where your product sits in that category determines everything about what it costs to build.
Table of Contents
Before estimating any custom analytics software development cost, you need to define the scope clearly.
Most projects fall into one of three types:
1. Internal Analytics Dashboard
A reporting tool built for your own team. It connects to your existing data sources, visualizes key metrics, and replaces spreadsheets or a generic BI tool.
- Users: Internal teams only
- Examples: Operations dashboard, sales performance tracker, financial reporting tool
- Complexity: Low to medium
2. Embedded Analytics Platform
Analytics built directly into your product, so your customers can see their own data inside your application. This is what companies build when Tableau can’t be white-labeled or when the user experience needs to feel native.
- Users: Your end customers
- Examples: SaaS platforms with in-app reporting, customer-facing data portals
- Complexity: Medium to high
3. Enterprise-Grade BI Platform
A standalone analytics product with multi-tenancy, role-based access control, a custom data warehouse, ETL pipelines, and advanced visualization. This is the most complex and the most expensive build.
- Users: Multiple organizations or large enterprise teams
- Examples: Industry-specific analytics platforms, white-label BI tools sold as a product
- Complexity: High to very high
Why this matters:
The cost to build an internal dashboard and the cost to build a full Tableau alternative are not in the same conversation. One starts at $40,000. The other can exceed $500,000.
Getting this definition right before you scope anything is the most important step and the one most teams skip.
Is Your BI Tool Costing More in Licenses Than it Delivers in Value?
Our team helps you move from expensive subscriptions to a custom-owned data asset.
What Are the Core Components That Drive Development Cost?
The cost of analytics software is not driven by dashboards. It is driven by the infrastructure beneath them. Most budget variation comes from how the system is designed at the data, processing, and access layers.
Below are the core components that determine the total build cost.
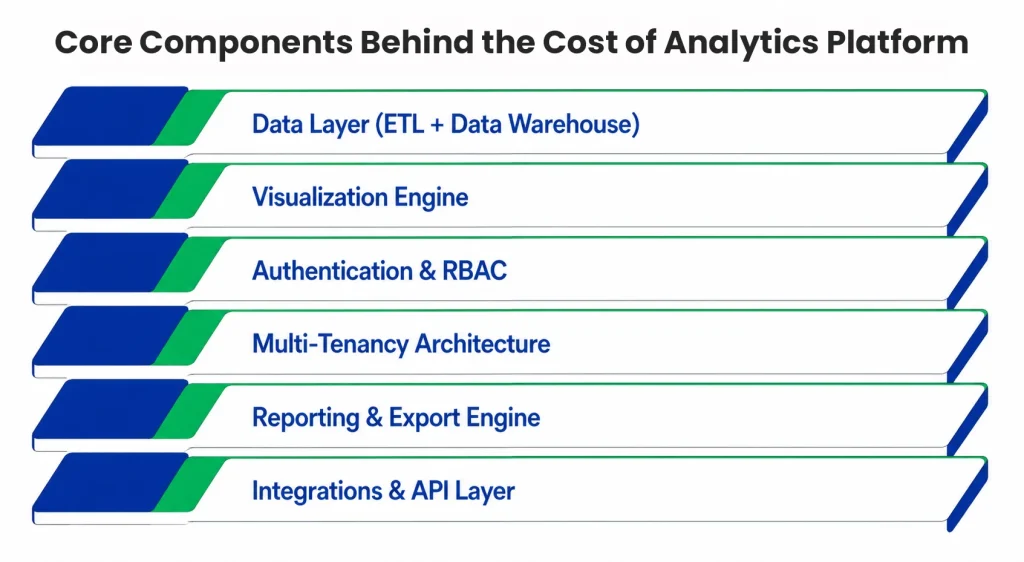
1. Data Layer (ETL Pipeline + Data Warehouse)
This is where data is collected, transformed, and stored. It defines if your analytics system is reliable or inconsistent at scale.
A weak data layer results in slow queries, inconsistent reporting, and unreliable metrics.
Building this foundation typically requires effective backend engineering services capable of designing scalable data pipelines, warehouse architecture, and high-throughput processing systems that can support BI-grade workloads.
- Includes: ETL pipeline, data warehouse setup (PostgreSQL, BigQuery, Snowflake), data modeling
- Cost Contribution: High, this is often 30–40% of total build cost
- Core Variables: Number of data sources, data volume, refresh frequency
2. Visualization Engine
This layer converts processed data into dashboards, charts, and reports. It defines how users interact with data inside the product.
Building a visualization engine from scratch using libraries like D3.js or Apache ECharts takes significant engineering time.
- Includes: Chart types, interactive filters, drill-downs, custom visual components
- Cost contribution: Medium to high
- Core Variables: Number of chart types, interactivity requirements, custom branding
3. Authentication and Role-Based Access Control (RBAC)
Not every user should access the same data. This layer controls how permissions are defined and enforced across the system.
Complex RBAC structures increase both development time and long-term maintenance cost.
- Includes: User authentication, permission levels, row-level security, audit logs
- Cost contribution: Medium
- Core Variables: Number of user roles, data sensitivity, compliance requirements
4. Multi-Tenancy Architecture
If you are building analytics software that serves multiple clients or organizations, each tenant needs isolated data, separate configurations, and independent access controls.
This architecture is one of the most complex and expensive components to build correctly.
- Includes: Tenant isolation, separate data schemas or databases, tenant-level customization
- Cost contribution: High
- Core Variables: Number of tenants, isolation requirements, white-labeling needs
5. Reporting and Export Engine
This layer enables users to extract and distribute data outside the platform. While simple in concept, it becomes complex when supporting multiple formats and scheduling logic.
- Includes: PDF export, CSV download, scheduled email reports, shareable dashboard links
- Cost contribution: Low to medium
- Core Variables: Export formats, scheduling complexity, delivery integrations
6. Integrations and API Layer
Analytics platforms depend entirely on external data sources. This layer defines how the system connects to those sources.
Each integration adds engineering effort, testing overhead, and maintenance cost.
- Includes: REST APIs, webhook support, native connectors, third-party data source integrations
- Cost contribution: Medium to high
- Core Variables: Number of integrations, data freshness requirements, API reliability
Component Cost Contribution at a Glance
Cost is not distributed evenly across components. Most of it concentrates on the data layer, integrations, and multi-tenancy design.
Visualization and reporting are visible parts of the product, but they are not the primary cost drivers. Architecture decisions determine the final build cost long before UI development begins.
Here’s how each component ranks, so you can see where your budget will focus before you start scoping.
| Component | Cost Contribution | Key Complexity Factor |
|---|---|---|
| Data Layer / ETL Pipeline | Very High | Data sources, volume, refresh rate |
| Visualization Engine | High | Chart types, interactivity |
| RBAC / Authentication | Medium | User roles, compliance |
| Multi-Tenancy | High | Tenant isolation, white-labeling |
| Reporting & Export | Low–Medium | Formats, scheduling |
| API & Integrations | Medium–High | Number of integrations |
How Much Does It Cost to Build Analytics Software?
Building custom analytics software does not have a single price tag. The cost depends on what you are building, who builds it, and how much complexity you are introducing at each layer.
That said, most projects fall into one of three tiers.
Here is what each one looks like in practice.
Tier 1: Internal Analytics Dashboard
- Estimated Cost: $40,000 – $100,000
- Timeline: 3–5 months
This is the entry-level build. A focused, internal-facing tool that connects to one or two data sources, displays key metrics, and replaces spreadsheets or a basic BI subscription.
Scope
- 5–10 dashboard views
- Basic ETL pipeline with 1–3 data sources
- User authentication with simple role separation
- Standard chart types: bar, line, pie, table
- CSV export
Not included
- Multi-tenancy
- Real-time data refresh
- Advanced access control
- Custom visualization components
This tier makes sense for startups and internal ops teams that need reliable reporting without the overhead of an enterprise BI tool.
Tier 2: Embedded Analytics Platform
- Estimated Cost: $100,000 – $250,000
- Timeline: 5–9 months
This range is where most product companies land. You are building analytics that live inside your application, visible to your customers, branded to your product, and connected to your data model.
Cost
- Customer-facing dashboards with white-label design
- Multi-source ETL pipeline
- Role-based access control with row-level security
- Interactive filters, drill-downs, and custom chart types
- Scheduled reports and PDF export
- API layer for data ingestion
Not included
- Full multi-tenancy architecture
- Real-time streaming data
- AI-powered insights or anomaly detection
This tier suits SaaS companies that need to give customers visibility into their own data without sending it to a third-party tool.
Tier 3: Enterprise-Grade BI Platform
- Estimated Cost: $250,000 – $500,000+
- Timeline: 9–18 months
This is the full Tableau alternative model. A standalone analytics product built for scale, serving multiple organizations, handling large data volumes, and supporting complex permission structures.
Scope
- Full multi-tenancy with tenant-level isolation
- Advanced RBAC with audit logs and compliance controls
- Custom data warehouse (Snowflake, BigQuery, or Redshift)
- Real-time and batch ETL pipelines
- Custom visualization engine
- White-labeling and tenant-level branding
- API-first architecture with native integrations
- Admin panel for tenant management
Not Included
- AI and machine learning features
- Mobile-native experience
- On-premise deployment options
This tier is for companies building analytics as a core part of their product or replacing an enterprise BI tool that no longer fits their scale or data model.
The Full Picture
Map your requirements against these tiers before you scope anything.
| Tier | Type | Estimated Cost | Timeline |
|---|---|---|---|
| Tier 1 | Internal Dashboard | $40,000 – $100,000 | 3–5 months |
| Tier 2 | Embedded Analytics | $100,000 – $250,000 | 5–9 months |
| Tier 3 | Enterprise BI Platform | $250,000 – $500,000+ | 9–18 months |
A note on these figures:
These ranges are based on a mid-market engineering team with a mix of senior and mid-level developers. Costs will vary based on team location, technology choices, existing infrastructure, and the level of customization required.
Does Your Budget Match Your Vision, or Are You Overpaying for Complexity?
We provide a transparent line-item breakdown to help you budget with 100% confidence.
The next section covers what pushes these numbers up or brings them down.
What Affects the Total Cost of Building Analytics Software?
The tiers give you a baseline. But two companies building the same type of analytics platform can still end up with budgets that differ by hundreds of thousands of dollars.
The difference comes down to a small set of variables. Each one either expands scope, adds infrastructure, or increases engineering time.
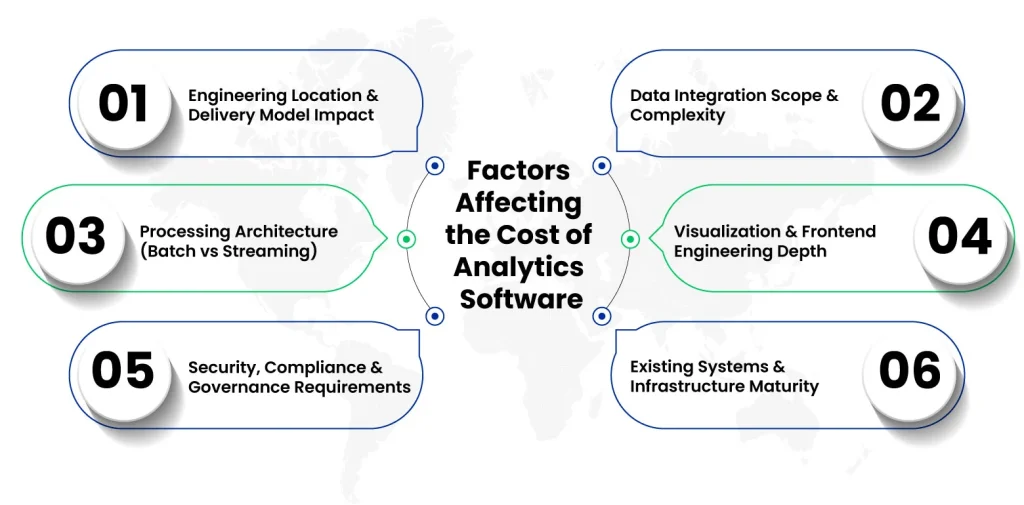
1. Team Location and Engagement Model
Engineering costs vary significantly by geography. Senior engineers in North America typically cost three to four times more than equally experienced engineers in Eastern Europe or South Asia.
An engagement model also affects the total cost structure. Dedicated teams operate with higher velocity and tighter alignment, while time-and-materials models introduce variability in delivery pace and forecasting.
2. Number of Data Sources and Integrations
Each data source introduces integration work, including authentication, schema mapping, error handling, and synchronization logic.
Single-source systems remain straightforward. Multi-source systems with heterogeneous formats and refresh requirements increase implementation complexity and engineering load in a linear to exponential manner.
3. Real-Time vs. Batch Data Processing
Batch processing operates on scheduled intervals such as hourly or daily refresh cycles. It requires simpler infrastructure and lower operational overhead.
Real-time processing introduces streaming architecture, state management, and higher infrastructure dependency. It increases both build complexity and ongoing system cost.
4. Customization in the Visualization Layer
Standard visualization components such as bar, line, pie, and table charts can be implemented using existing libraries with minimal engineering effort.
Custom visualization layers require additional development time due to bespoke rendering logic, interaction models, and performance optimization requirements.
Cost increases directly with the level of customization and interactivity required in the front-end layer.
5. Compliance and Security Requirements
Regulated environments such as healthcare, finance, and enterprise SaaS introduce mandatory compliance constraints.
Requirements such as HIPAA, SOC 2, and GDPR affect data storage architecture, access control systems, audit logging, and data transmission protocols. These requirements must be integrated into the system architecture from the initial design phase.
6. Existing Infrastructure
Pre-existing systems reduce implementation scope. Data warehouses, authentication services, and API layers reduce the amount of foundational engineering required.
Greenfield builds require full-stack implementation across ingestion, processing, and access layers, increasing both cost and delivery timeline.
What to Look for in a Custom Analytics Software Development Partner?
The development partner you choose shapes the entire outcome of your analytics build. A generalist team can build interfaces. Very few can architect a reliable data layer, model a complex warehouse, and make the right scalability decisions from day one.
The wrong partner at this stage slows you down and produces architecture decisions that are expensive to undo later.
These are the factors that actually matter when evaluating who builds this for you.
- Data Engineering Experience
A lot of development teams can build a dashboard. Far fewer can architect a reliable ETL pipeline, model a complex data warehouse, or design a multi-tenant data layer that holds up at scale.
Ask specifically about their data engineering experience, not just the interfaces they have built on top of it.
1. Familiarity With the Right Stack
Your partner should have hands-on experience with the tools that analytics platforms actually run on: PostgreSQL, BigQuery, Snowflake, Redshift, D3.js, Apache Kafka, and similar. A team that is learning these on your project is a team that is billing you for their education.
This level of execution typically comes from a reliable cloud engineering and DevOps partner who understands how to configure scalable data infrastructure, manage distributed systems, and maintain performance under heavy analytical workloads.
2. Architecture-First Thinking
The most expensive mistakes in analytics builds happen at the architecture stage, not the development stage. A good partner slows down at the start to get the data model, access control structure, and scalability assumptions right before writing a single line of code.
If a team is eager to start building immediately, it raises a concern.
3. Honest Scoping and Transparent Pricing
A trustworthy partner gives you a detailed scope breakdown before the project starts. They tell you what is included, what is not, and what decisions will affect the final cost. A fixed-cost project should come with a clear scope, not surprises halfway through the build.
If a partner cannot explain what determines the cost of your specific build, they are not ready to build it.
At Clustox, our custom software development team builds analytics platforms for startups, SaaS companies, and enterprises, from internal dashboards to enterprise-grade BI platforms. If you are scoping a build, we can help you define the right tier, choose the right stack, and arrive at a realistic budget before you commit to anything.
The Bottom Line
The cost to build analytics software like Tableau is not unknowable. It is a function of scope, complexity, and the decisions made before a single line of code is written.
The companies that get this right are not the ones with the biggest budgets. They are the ones that took the time to define what they were building, understood what would move the cost, and worked with a team that had done it before.
That is the difference between a platform that compounds in value and one that compounds in technical debt.
Frequently Asked Questions
2. What is the Difference Between Building and Buying Analytics Software?
Buying a tool like Tableau or Power BI is faster and cheaper upfront but comes with limitations around data ownership, customization, and long-term pricing. Building custom analytics software requires more upfront investment but gives you full control over your data model, user experience, and cost structure. The right choice depends on if analytics is infrastructure or a core part of your product.
3. What is the Most Expensive Part of Building Analytics Software?
The data layer, including the ETL pipeline and data warehouse, is typically the most expensive component, accounting for 30–40% of total build cost. Multi-tenancy architecture is the second most expensive component for platforms serving multiple clients or organizations.
4. Can You Reduce the Cost to Build Analytics Software?
Yes, but only by reducing scope and complexity. The cost to build analytics software drops when you start with batch processing, limit integrations, and use standard components instead of custom builds. Most teams lower their custom analytics software development cost by avoiding complex infrastructure in the first release.
5. Is It Better to Build vs. Buy Analytics Software?
It depends on how central analytics is to your product. Build vs. buy analytics decisions usually come down to control, scalability, and long-term cost. If tools like Tableau or Power BI limit your use case, building a custom solution becomes the better option.
6. What Ongoing Costs Should You Expect After Launch?
The initial analytics dashboard development cost is only part of the investment. Ongoing costs, including infrastructure, maintenance, and scaling your ETL pipeline and data warehouse, typically range from 15–25% of the build cost annually. These costs increase as data volume and usage grow.
Still Have Questions About the Specific Data Stack or Security Requirements of Your Analytic Software?
Speak directly with a Senior Architect to clear the path for your project.