The last thing any engineering leader wants is to get blindsided by an outage. Nothing destroys credibility faster than:
Customer complaints flooding in…
Dashboards giving no clear answers…
Everyone asking, “What’s happening?”…
And the worst of all, scrambling blindly to find the root cause.
New Relic’s 2025 Observability Report shows outages now cost $2 million per hour. That’s why companies are moving toward full-stack observability.
Nowadays, both businesses and DevOps experts turn to a variety of monitoring tools, including Sentry, Datadog, New Relic, Grafana, and more. Choosing the right tools can mean the difference between quickly resolving issues and hours of chaos.
But there’s a caveat: having more observability tools than you actually need (and for the same purposes) can lead to something called tool sprawl. That’s no better than the outages themselves.
Table of Contents
Today, we’re going to pull back the curtains on the Datadog vs. Sentry debate and compare both of these on the same grounds.
Keep going, because this might help you avoid costly downtime.
Sentry vs. Datadog: A Quick Overview
What Is Sentry?
Sentry is a leading application monitoring platform built to help developers with error monitoring and error tracking. It provides insights into application issues, assisting teams to quickly identify problems in real time without wading through endless logs.
Sentry is used by 4M developers and 140,000 organizations worldwide, including Disney+, GitHub, Atlassian, Cloudflare, and more.
Core Capabilities:
- Real-time error tracking
- Cross-platform monitoring
- Issue grouping and breadcrumbs
- Release tracking and performance insights
- Application Performance Monitoring (APM)
What Is Datadog?
Datadog is a comprehensive cloud-based platform for full-stack observability, giving cloud engineering teams clear visibility into applications, infrastructure, and cloud services. It combines APM, log management, and real user monitoring (RUM) in a single interface.
As of 2025, Datadog ranks on Forbes’ 2000 list and serves 30,500 customers worldwide, including leading companies such as Samsung, Toyota, NASDAQ, Shell, and more.
Core Capabilities:
- Infrastructure monitoring and cloud monitoring
- Application Performance Monitoring (APM)
- Alerting and incident management
- Log management and live tail logs
- Dashboards and custom metrics
Datadog vs. Sentry: Side-by-Side Features Comparison
When your systems go down, every minute counts. Teams need tools that give clear visibility into errors, performance bottlenecks, and infrastructure monitoring so they can respond fast and avoid costly downtime. Observability gaps can quickly turn minor issues into major incidents if left unnoticed.
Let’s take a clear, side-by-side look at how Sentry and Datadog handle the core capabilities teams rely on so you can see which one fits your workflow and avoids blind spots in your observability setup.
| Feature | Datadog | Sentry |
|---|---|---|
| Core Focus | Full-stack observability: infrastructure, APM, logs, security monitoring | Error tracking and application performance monitoring |
| Error Tracking | Included in APM, less specialized | Excellent, detailed error tracking with rich context |
| Application Performance Monitoring (APM) | Advanced distributed tracing, performance metrics | Focused on tracing slow transactions and bottlenecks |
| Infrastructure Monitoring | Comprehensive (hosts, containers, cloud) | Limited, focused on app-level insights |
| Log Management | Centralized logging, live tailing, and log analytics | Limited logging support |
| Dashboards and Analytics | Highly customizable dashboards and report generation | Basic dashboards focused on errors and performance |
| Alerting & Notifications | Advanced alerts, multi-channel notification support | Alerts optimized around issues/errors |
| Integration Ecosystem | Extensive integrations (1000+), multi-cloud support | Strong developer tool integrations |
| Session Replay | Supported | Supported for error context |
| Real User Monitoring (RUM) | Full support | Partial, via performance monitoring |
| Custom Metrics & Telemetry Signals | Full support | Focused on error-related metrics |
| Ease of Setup & Use | More complex due to a broad feature set | Simple and intuitive for error-tracking use cases |
| Deployment Options | Cloud SaaS only | Cloud SaaS and a self-hosted open-source option |
| Best For | Full-stack observability Infrastructure & cloud monitoring Large, distributed teams | Real-time error tracking Small to mid-size dev teams Quick issue resolution |
Stop Outages Before They Disrupt Your Business
Clustox helps engineering teams implement observability practices that reduce downtime and resolve issues fast.
How Do Datadog And Sentry Compare In Pricing?
For large enterprises, Datadog’s pricing is rarely a concern because the value of full-stack visibility and advanced monitoring justifies the investment.
However, growing teams often hit a wall. You might only need error tracking, but you end up paying for features you don’t use. Or you need full infrastructure observability, while your plan only scratches the surface.
Understanding what each tool includes and how pricing scales is crucial. Let’s break down Sentry vs. Datadog pricing so you can see which fits your needs.
1. Pricing Model
Sentry combines seat-based plans with usage-based charges for events, replays, and other data, which makes baseline costs predictable while still scaling with error and traffic volume.
- Events: charged per million beyond quota
- Seats: fixed per user across tiers
Datadog uses a modular, SKU-based model where you pay per host, per GB of logs, and per monitor. Per feature (APM, RUM, synthetics, etc.), the total cost is heavily tied to infrastructure size and data ingestion volume.
- Infrastructure: $15/host/month
- Logs: $1.27/GB ingested
- APM: $31/host/month
2. Free Tier and Trial Options
Sentry offers a permanent free Developer plan with limited monthly events and basic monitoring features, giving small teams a workable entry point without immediate spending.
- Limits: 5K events, 1-month retention
- No credit card for trial
Datadog provides a time-limited free trial and a restricted free tier primarily suited for evaluation, with most production use cases quickly requiring paid SKUs for infrastructure, APM, and logs.
- Free: 5 hosts, basic metrics
- Trial: 14 days for all products
3. Paid Plans and Tiers
Sentry has three paid tiers. These are published with transparent per-seat pricing and bundled event quotas, with higher tiers enabling advanced features such as SSO, increased limits, and enterprise governance.
- Team: $26/mo, 50K events
- Business: $80/mo, 500K events
- Enterprise: custom quotas/SLAs
Datadog’s Pro and Enterprise tiers are priced per host for core products (like Infrastructure and APM), with additional per-GB or per-event pricing for logs and synthetics, and enterprise features are often negotiated via custom contracts.
- Infra Pro: $15/host (annual)
- APM Pro: $31/host
- Log Management: $1.27/GB + indexing
4. Cost Effectiveness
Sentry delivers greater cost-effectiveness for error tracking needs due to straightforward pricing, a free tier, and a self-hosting option, making it ideal for dev teams with $10K/year or less in spending.
Datadog justifies higher costs for enterprises requiring full observability by offering comprehensive features and ROI through reduced MTTR, but requires strict cost controls to avoid 2-5x overages.
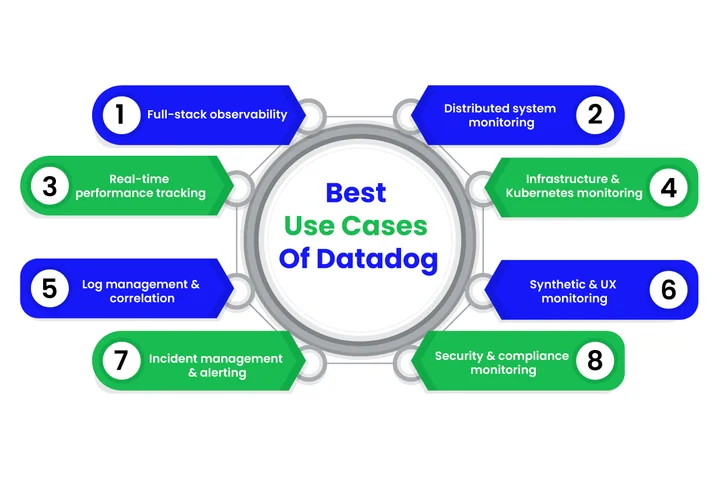
Which Are Datadog’s Best Use Cases?
Datadog is ideal for engineering teams who need full visibility across infrastructure and applications. It helps you spot performance issues early, prevent downtime, and keep complex systems running smoothly.
Here’s a closer look at the use cases of Datadog:
| Use Case | Description |
|---|---|
| Full-Stack Observability | Unifies metrics, logs, traces, and security data for seamless diagnostics. |
| Distributed System Monitoring | Monitors microservices, service meshes, and multi-layer systems to prevent cascading failures. |
| Real-Time Application Performance Tracking | Detects latency spikes and slow endpoints before users are affected. |
| Infrastructure & Kubernetes Monitoring | Provides visibility into pods, nodes, autoscaling, and deployments. |
| Log Management & Correlation | Quickly search, filter, and link logs to metrics and traces. |
| Synthetic & UX Monitoring | Validates user journeys, tests APIs, and tracks frontend performance. |
| Incident Management & Alerting | Handles alert workflows, on-call schedules, and automated diagnostics. |
| Security & Compliance Monitoring | Monitors cloud security, detects threats, and ensures compliance. |
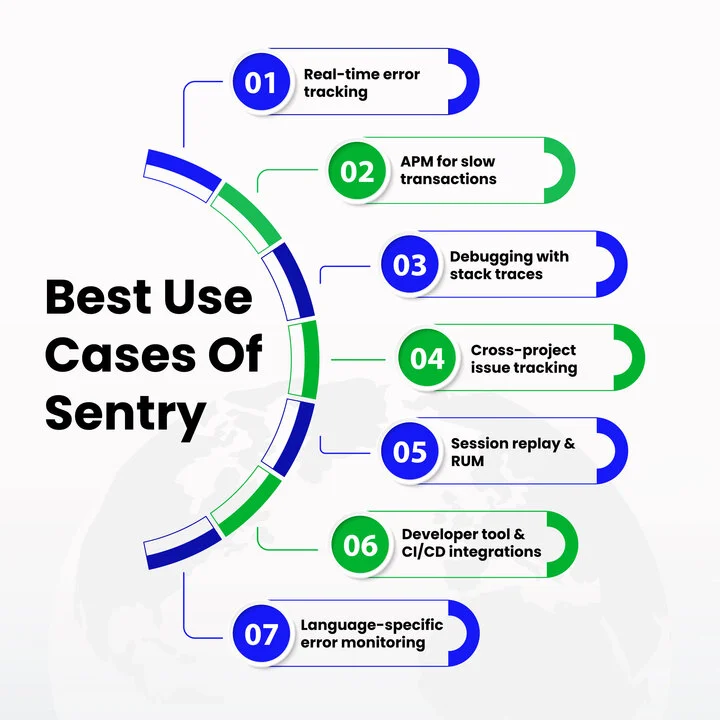
What Are The Best Use Cases Of Sentry?
Sentry is ideal for teams that want to spot errors instantly and fix them before they impact users. It helps developers trace slow transactions, debug issues, and maintain app performance without getting lost in logs.
Let’s break down the specific use cases where Sentry delivers the most value:
| Use Case | Description |
|---|---|
| Real-Time Error Tracking | Spot crashes and exceptions immediately with context for faster fixes. |
| APM for Slow Transactions & Bottlenecks | Identify slow database calls and heavy functions affecting app speed. |
| Debugging with Stack Traces & Breadcrumbs | Step-by-step trails to reproduce and fix errors efficiently. |
| Cross-Project Issue Tracking | Track related errors across multiple apps or services in one workflow. |
| Session Replay & RUM | See exactly what users experienced to resolve frontend issues quickly. |
| Developer Tool & CI/CD Integrations | Integrate with GitHub, Jira, GitLab, and pipelines for smoother deployments. |
| Language-Specific Error Monitoring | Supports Python, JS, React, Node, Java, Ruby, PHP, and Go with minimal setup. |
Common Observability Pitfalls Engineering Teams Face
Having the right tools is one thing; using them well is another. Practical industry expertise and strategy make all the difference. Clustox helps teams configure monitoring so systems run smoothly and alerts deliver real insight instead of noise.
Following are some of the most common challenges, engineering teams are facing today:
1. Tool Sprawl
Teams often add multiple observability tools without a clear plan, leading to overlapping features, wasted spend, and confusion. Without a strategy, dashboards can become cluttered and hard to act on.
Example
A fast-growing SaaS company was running Datadog, Sentry, and Prometheus simultaneously. Clustox helped consolidate the telemetry, eliminated duplicate metrics, and reduced tool-related costs by 30%.
2. Poor Implementation
Even the best tools fail when configured incorrectly. Misapplied dashboards, incomplete alert rules, or lack of tagging can make monitoring unreliable and leave blind spots.
Example
A mid-sized e-commerce team kept missing errors during peak sales days because alerts weren’t tuned for priority events. Clustox restructured their monitoring workflows, ensuring alerts were actionable and meaningful.
3. Alert Fatigue
Too many low-value or duplicate alerts overwhelm teams, causing critical issues to be ignored. Alert fatigue slows response times and increases downtime risk.
Example
A global fintech team received hundreds of non-critical alerts per day. Clustox implemented alert prioritization and noise reduction, cutting unnecessary alerts by 70% and improving MTTR.
4. Misconfigured Observability
Teams can have visibility but still fail to connect the dots between logs, metrics, and traces. Misalignment across layers results in slow root cause identification.
Example
A SaaS company using Datadog for infrastructure monitoring and Sentry for error tracking couldn’t correlate issues across the stack. Clustox integrated the tools strategically, enabling faster diagnostics and proactive issue prevention.
5. Paying 2–5× More Than Needed
Without a guided strategy, companies often pay for premium features they don’t fully use or scale improperly across teams, leading to inflated costs.
Example
A startup was paying for enterprise Datadog modules but only needed basic error and performance tracking. Clustox recommended a tiered plan, optimized usage, and saved 40% on monitoring costs while maintaining coverage.
Wrapping Up: Choosing Between Datadog And Sentry
Datadog and Sentry each address distinct observability needs. Datadog, being one of the best DevOps tools for hybrid cloud orchestration, gives teams comprehensive visibility across infrastructure and applications, while Sentry excels at pinpointing errors and optimizing application performance.
Based on experience with companies facing similar challenges, the recommended approach is to choose the tool that aligns with your priorities and pair it with a structured implementation strategy to maximize value.
At Clustox, we guide teams in configuring these platforms strategically, ensuring monitoring reduces downtime, prevents tool sprawl, and delivers actionable alerts. Our approach ensures observability supports decision-making and operational efficiency without adding complexity or unnecessary cost.
Frequently Asked Questions (FAQs)
2. Which Tool Works Better For Growing Teams On A Budget?
For small or scaling teams, Sentry’s free tier and simple pricing make monitoring errors predictable and affordable. Datadog offers broad observability, but costs can grow quickly with hosts, logs, and APM features. Understanding your usage patterns ensures you get visibility without paying for features you don’t need.
3. What Are Other Monitoring Tools Beyond Datadog And Sentry?
Here are some other monitoring tools you might consider, each offering different strengths for error tracking, infrastructure insights, and observability.
- Dynatrace: AI-powered insights for performance and cloud environments
- Prometheus: Metrics collection and monitoring for microservices
- Elastic Observability: Centralized logging, metrics, and APM
- Grafana: Open-source dashboards and alerting for metrics
- New Relic: Full-stack visibility for apps and infrastructure
- Splunk: Log analytics and operational intelligence
These tools offer alternatives for teams balancing error tracking, infrastructure monitoring, and cost efficiency, helping you pick the right fit for your workflow.
Choose the Right Observability Tools for Your Team
Clustox combines deep observability expertise with strategic guidance, to implement Sentry or Datadog effectively to reduce downtime, prevent tool sprawl, and optimize monitoring workflows.